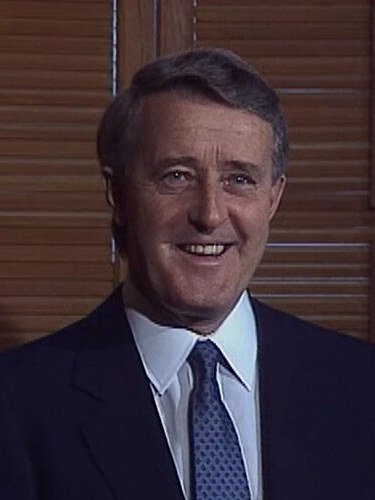
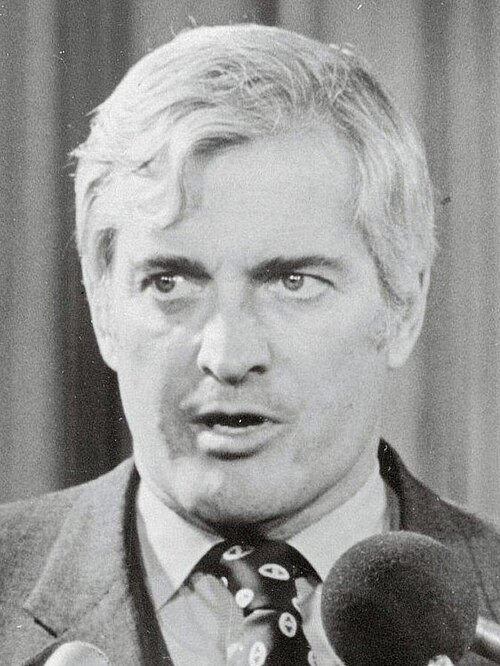
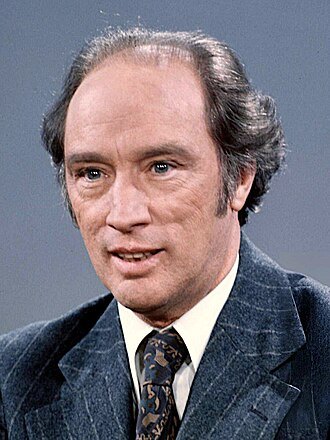
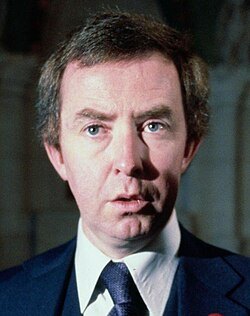
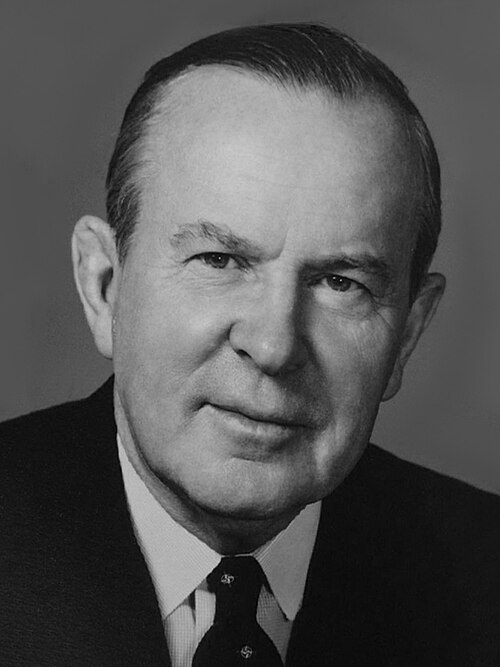
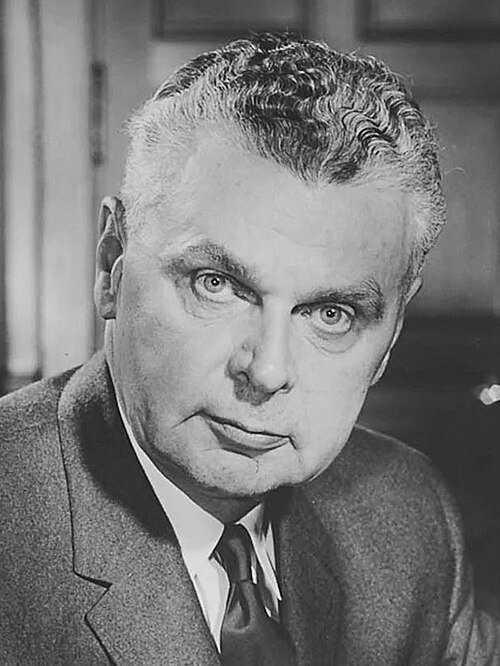
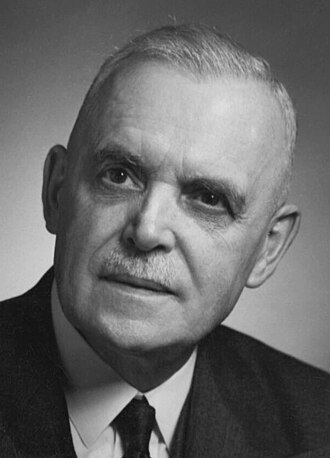
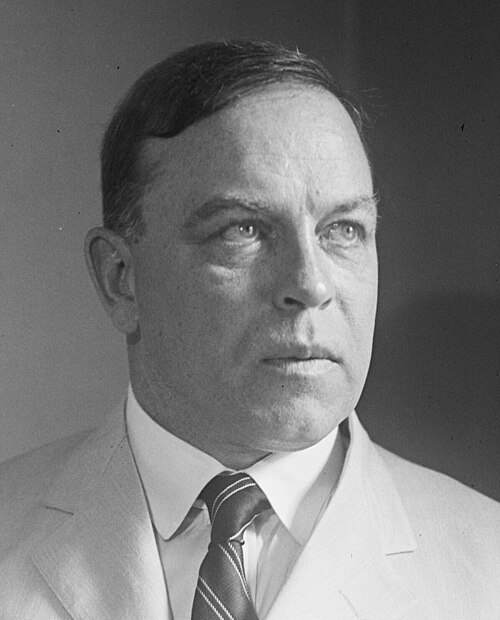
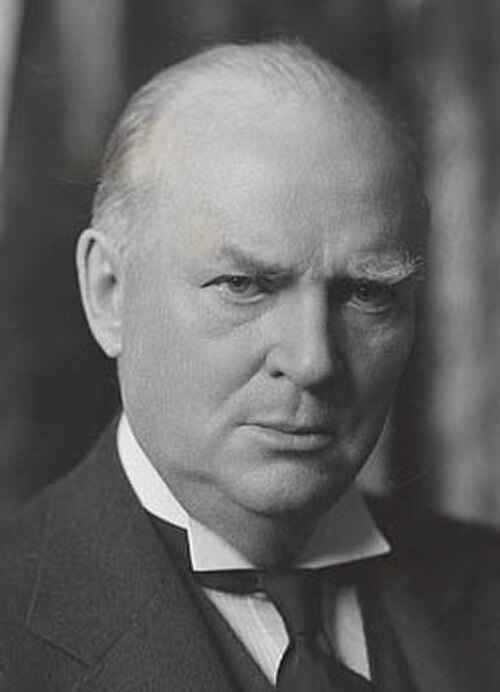
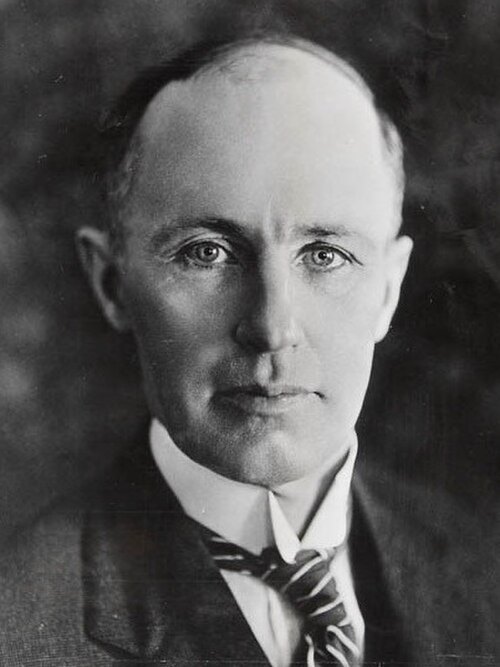
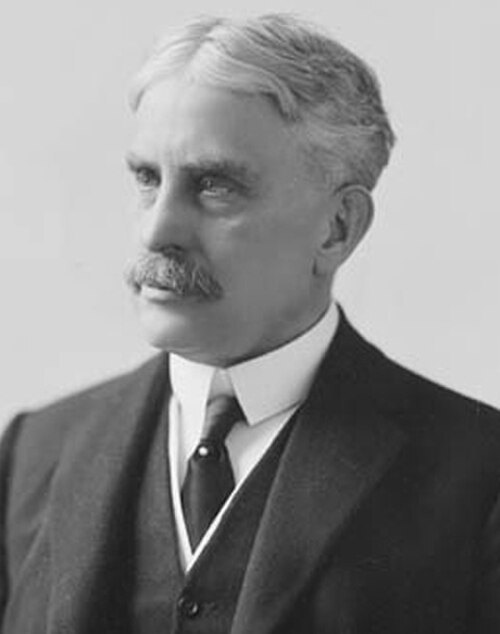
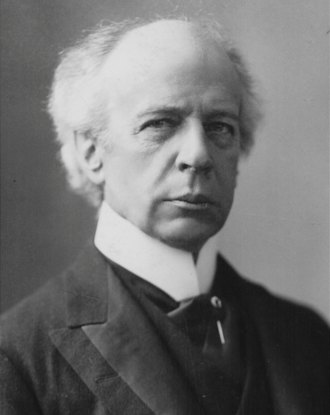
Home › Prime Ministers Prime Ministers of Canada Every prime minister of Canada since Confederation in 1867, with portraits, biographies and how the public debt changed while each was in office.
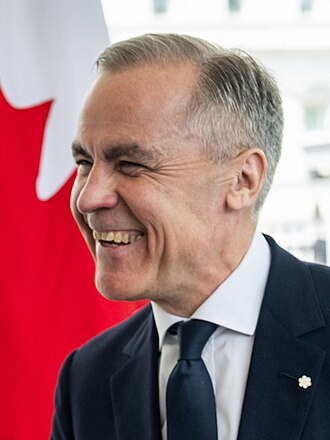
Every prime minister since 1867 24th Prime Minister · In office now
2025–present
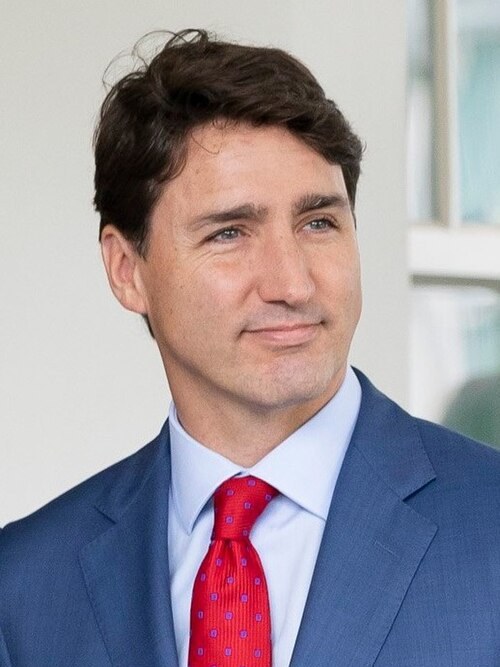
23rd Prime Minister
2015–2025
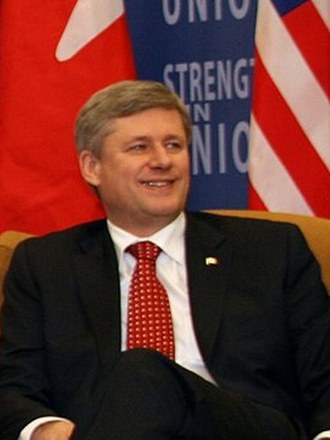
22nd Prime Minister
2006–2015
21st Prime Minister
2003–2006
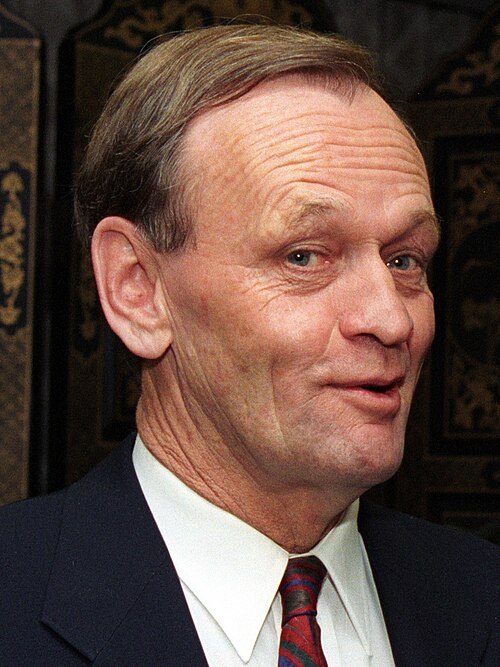
20th Prime Minister
1993–2003
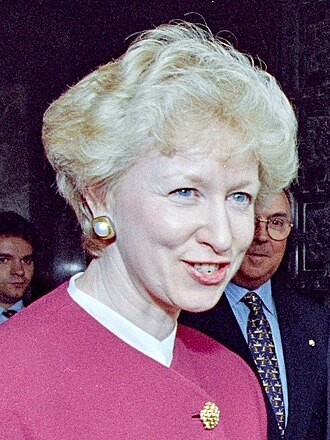
19th Prime Minister
1993
18th Prime Minister
1984–1993
17th Prime Minister
1984
15th Prime Minister
1968–1979; 1980–1984
16th Prime Minister
1979–1980
14th Prime Minister
1963–1968
13th Prime Minister
1957–1963
12th Prime Minister
1948–1957
10th Prime Minister
1921–1926; 1926–1930; 1935–1948
11th Prime Minister
1930–1935
9th Prime Minister
1920–1921; 1926
8th Prime Minister
1911–1920
7th Prime Minister
1896–1911
6th Prime Minister
1896
5th Prime Minister
1894–1896
4th Prime Minister
1892–1894
3rd Prime Minister
1891–1892
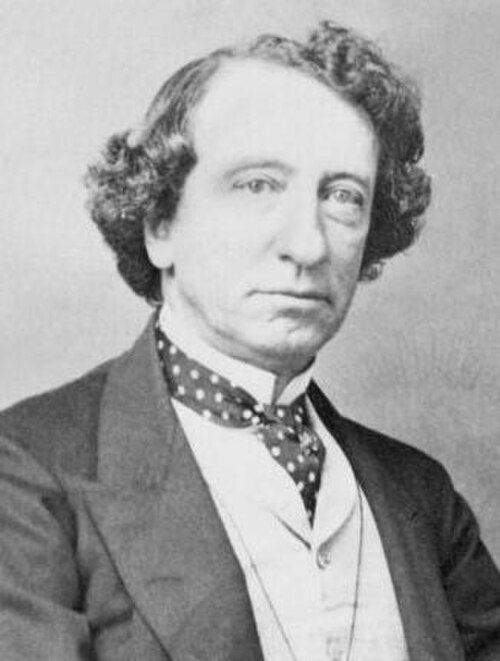
1st Prime Minister
1867–1873; 1878–1891
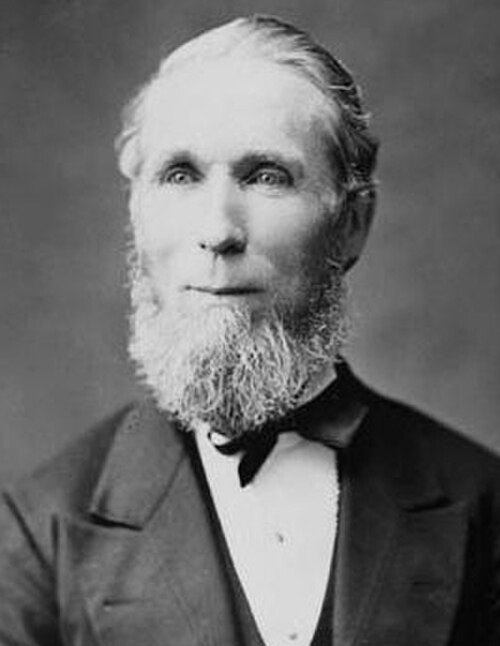
2nd Prime Minister
1873–1878
National debt by prime minister How Canada's public debt changed under every prime minister, measured the same way for all of them: as a share of the economy (GDP), and in dollars where GDP figures exist.
Updated 11 Oct 2026 24th Prime Minister · In office now
Too early to measure: the latest annual figure (end-2024, 110.8% of GDP) is from before Mark Carney took office. The change appears when the next year's figures are published.
Every ministry since 1867 +18.8 pts
Debt to GDP 92% → 110.8%
Measured at end-2015 → end-2024
In dollars (at the time) $1.83 trillion → $3.44 trillion +21.4 pts
Debt to GDP 70.6% → 92%
Measured at end-2005 → end-2015
In dollars (at the time) $1.00 trillion → $1.83 trillion -5.3 pts
Debt to GDP 75.9% → 70.6%
Measured at end-2003 → end-2005
In dollars (at the time) $952.4 billion → $1.00 trillion -18.8 pts
Debt to GDP 94.7% → 75.9%
Measured at end-1993 → end-2003
In dollars (at the time) $707.4 billion → $952.4 billion +6.5 pts
Debt to GDP 88.2% → 94.7%
Measured at end-1992 → end-1993
In dollars (at the time) $633.7 billion → $707.4 billion +28 pts
Debt to GDP 60.2% → 88.2%
Measured at end-1984 → end-1992
In dollars (at the time) $278.1 billion → $633.7 billion +3 pts
Debt to GDP 57.2% → 60.2%
Measured at end-1983 → end-1984
In dollars (at the time) $241.0 billion → $278.1 billion +13 pts
Debt to GDP 44.2% → 57.2%
Measured at end-1979 → end-1983
In dollars (at the time) $126.3 billion → $241.0 billion 16 Joe Clark -2.9 pts
Debt to GDP 47.1% → 44.2%
Measured at end-1978 → end-1979
In dollars (at the time) $117.9 billion → $126.3 billion -9.9 pts
Debt to GDP 57% → 47.1%
Measured at end-1967 → end-1978
In dollars (at the time) $40.5 billion → $117.9 billion -9.6 pts
Debt to GDP 66.6% → 57%
Measured at end-1962 → end-1967
In dollars (at the time) $30.1 billion → $40.5 billion +8.2 pts
Debt to GDP 58.4% → 66.6%
Measured at end-1956 → end-1962 -54.6 pts
Debt to GDP 113% → 58.4%
Measured at end-1948 → end-1956 +7.8 pts
Debt to GDP 105.2% → 113%
Measured at end-1935 → end-1948 +44.4 pts
Debt to GDP 60.8% → 105.2%
Measured at end-1930 → end-1935 -2.1 pts
Debt to GDP 62.9% → 60.8%
Measured at end-1926 → end-1930 -2 pts
Debt to GDP 64.9% → 62.9%
Measured at end-1925 → end-1926 -9.2 pts
Debt to GDP 74.1% → 64.9%
Measured at end-1921 → end-1925 +15.7 pts
Debt to GDP 58.4% → 74.1%
Measured at end-1920 → end-1921 +37.7 pts
Debt to GDP 20.7% → 58.4%
Measured at end-1911 → end-1920 -23.5 pts
Debt to GDP 44.2% → 20.7%
Measured at end-1896 → end-1911 -0.2 pts
Debt to GDP 44.4% → 44.2%
Measured at end-1895 → end-1896 +2 pts
Debt to GDP 42.4% → 44.4%
Measured at end-1894 → end-1895 +4.8 pts
Debt to GDP 37.6% → 42.4%
Measured at end-1892 → end-1894 -0.3 pts
Debt to GDP 37.9% → 37.6%
Measured at end-1890 → end-1892 -3.1 pts
Debt to GDP 41% → 37.9%
Measured at end-1878 → end-1890 +13.5 pts
Debt to GDP 27.5% → 41%
Measured at end-1873 → end-1878 -1.5 pts
Debt to GDP 29% → 27.5%
Measured at end-1870 → end-1873 (earliest figure available (1870)) How this is measured: gross public debt of all levels of government (federal and provincial combined) as a share of GDP at the year-end nearest each change of prime minister. From 1950 the figures are the IMF Global Debt Database's general government debt; earlier years use the IMF's historical public debt series. Dollar amounts apply that share to the year's GDP (World Bank, from 1960) and are not adjusted for inflation; the share of GDP is the comparable measure. A sitting prime minister is measured to the latest year available. Prime ministers do not borrow alone: Parliament approves every budget, and wars, recessions and interest rates shape the numbers. Updated automatically every month. See the live national debt clock .