Federal debt divided by 41,651,653 people (2025).
Federal debt · live estimate
Canada's National Debt
$1,367,918,055,479
Growing by about $2,071 every second, $178.9 million a day, at the pace of the projected $65.3 billion deficit for 2026–27.
Estimate of the federal accumulated deficit, built from Department of Finance figures. Figures reviewed 11 October 2026.
Since midnight, your time.
Since April 1; $58.7 billion projected for the year, about $1,861 a second.
Accumulated deficit at March 31, 2025 (42.1% a year earlier).
Federal debt by year
Accumulated deficit at March 31 of each fiscal year, with that year's deficit.
| Fiscal year | Federal debt | Deficit | Debt to GDP | Status |
|---|---|---|---|---|
| 2023–24 | $1,236.2 billion | $61.9 billion | 42.1% | Actual |
| 2024–25 | $1,266.5 billion | $36.3 billion | 41.2% | Actual |
| 2025–26 | $1,333.4 billion | $66.9 billion | – | Estimate |
| 2026–27 | $1,398.7 billion | $65.3 billion | – | Projection |
| 2029–30 | $1,576.0 billion | – | 41.8% | PBO projection |
Debt across every level of government
Fiscal 2024–25, national-accounts basis at market value. Gross debt counts every liability (bonds, public-service pensions, accounts payable); net debt subtracts financial assets.
| Gross debt | % of GDP | Net debt | % of GDP | |
|---|---|---|---|---|
| Federal government | $1,864.2 billion | 60% | $1,062 billion | 34.2% |
| Provinces, territories and local | $1,607.7 billion | 51.7% | – | – |
| All governments | $3,385.2 billion | 108.9% | $1,605 billion | 51.6% |
That is $81,423 of gross debt per person. Interest paid by all governments reached $102.4 billion in 2024–25. The two levels do not add up exactly because money governments owe each other is netted out.
Provincial debt
Gross debt of each province in 2024–25, consolidated with its local governments, and as a share of the province's GDP.
150 years of public debt
Gross debt as a share of GDP: all governments since 1870, the federal government since 1990.
- 1945 After the Second World War, debt of all governments reached about 150% of GDP.
- 1995–96 Federal net debt peaked at 68% of GDP before the deficit cuts of the 1990s.
- 2020 Pandemic spending pushed debt of all governments to a record $2,852 billion, 129% of GDP.
- 2024–25 Federal net debt passed one trillion dollars for the first time ($1,062 billion).
Show the data by decade
| Year | All governments | Federal |
|---|---|---|
| 1870 | 29% | – |
| 1880 | 38.6% | – |
| 1890 | 37.9% | – |
| 1900 | 32.2% | – |
| 1910 | 19.2% | – |
| 1920 | 58.4% | – |
| 1930 | 60.8% | – |
| 1940 | 91% | – |
| 1950 | 87.7% | – |
| 1960 | 64.9% | – |
| 1970 | 56.7% | – |
| 1980 | 44.6% | – |
| 1990 | 73.7% | 51.2% |
| 2000 | 80.4% | 46.3% |
| 2010 | 84% | 44.1% |
| 2020 | 118.1% | 60.6% |
| 2024 | 110.8% | 52% |
How Canada compares with the G7
General government gross debt as a % of GDP, 2025 (IMF). Countries are compared on this basis because the split of responsibilities between levels of government differs from country to country.
National debt by prime minister
How Canada's public debt changed under every prime minister, measured the same way for all of them: as a share of the economy (GDP), and in dollars where GDP figures exist.
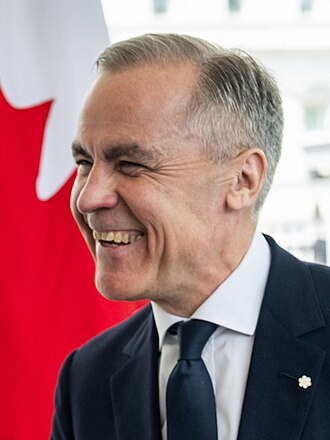
Too early to measure: the latest annual figure (end-2024, 110.8% of GDP) is from before Mark Carney took office. The change appears when the next year's figures are published.
Earlier prime ministers
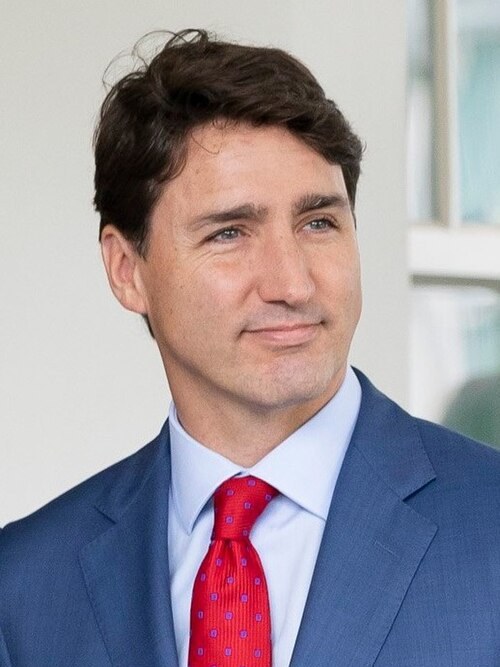
- 23Justin Trudeau Liberal · 2015–2025+18.8 pts
- Debt to GDP
- 92% → 110.8%
- Measured at
- end-2015 → end-2024
- In dollars (at the time)
- $1.83 trillion → $3.44 trillion
- 22Stephen Harper Conservative · 2006–2015+21.4 pts
- Debt to GDP
- 70.6% → 92%
- Measured at
- end-2005 → end-2015
- In dollars (at the time)
- $1.00 trillion → $1.83 trillion
- 21Paul Martin Liberal · 2003–2006-5.3 pts
- Debt to GDP
- 75.9% → 70.6%
- Measured at
- end-2003 → end-2005
- In dollars (at the time)
- $952.4 billion → $1.00 trillion
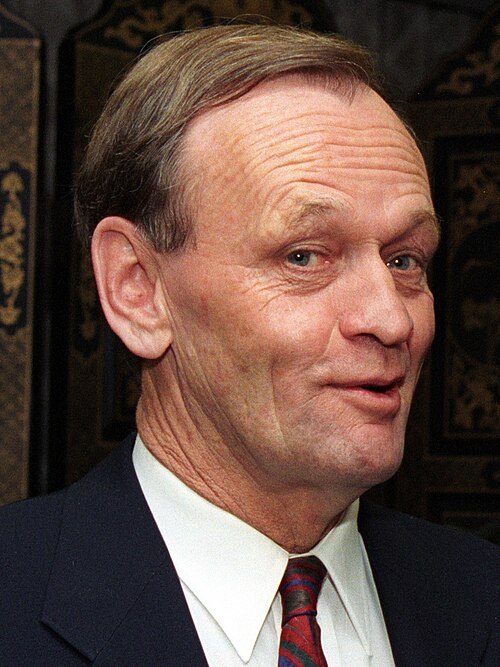
- 20Jean Chrétien Liberal · 1993–2003-18.8 pts
- Debt to GDP
- 94.7% → 75.9%
- Measured at
- end-1993 → end-2003
- In dollars (at the time)
- $707.4 billion → $952.4 billion


How these figures are measured
The clock starts from the federal debt at the beginning of fiscal 2026–27 ($1,333.4 billion: the actual debt at March 31, 2025, plus the estimated 2025–26 deficit) and adds the projected 2026–27 deficit, spread evenly over the year. Interest follows projected public debt charges. It is an estimate: the real debt moves month to month with tax receipts and spending.
Federal debt, or the accumulated deficit, is the measure the Department of Finance uses: the federal government's total liabilities minus all of its assets. It grows each year by the amount of the deficit.
Gross and net debt of all governments come from Statistics Canada on the international national-accounts standard, the basis the IMF and OECD use to compare countries. The long-run series back to 1870 comes from the IMF's historical public debt database.
The figures on this page are reviewed with every Annual Financial Report, budget and economic update; IMF and World Bank data refresh automatically every month.
Sources
- Annual Financial Report of the Government of Canada, 2024–2025
- Spring Economic Update 2026 (Department of Finance Canada)
- Parliamentary Budget Officer: assessment of the Spring Economic Update
- Statistics Canada, Table 10-10-0147-01: Canadian government finance statistics, balance sheet
- IMF World Economic Outlook database
- IMF Global Debt Database
Frequently asked questions
How much is Canada's national debt?
The federal debt (accumulated deficit) was $1,266.5 billion on March 31, 2025, according to the Annual Financial Report of the Government of Canada. With the estimated $66.9 billion deficit for 2025–26, it was about $1,333.4 billion at the start of fiscal 2026–27, and the clock on this page estimates it continuously from there.
How fast is the debt growing?
The projected deficit for 2026–27 is $65.3 billion, which works out to about $2,071 every second, or $178.9 million a day.
How much federal debt is there per Canadian?
About $32,842 per person, dividing the estimated federal debt by Canada's population (41,651,653 people in 2025).
How much interest does Canada pay on its debt?
Federal public debt charges are projected at $58.7 billion in 2026–27. In 2024–25, interest paid by all governments together came to $102.4 billion ($50.1 billion federal and $52.5 billion provincial, territorial and local).
What is the difference between federal debt and total public debt?
Federal debt (the accumulated deficit) is the federal government's liabilities minus its assets. Gross debt of all governments together (federal, provincial, territorial and local) was $3,385.2 billion, 108.9% of GDP, in 2024–25; net debt, which subtracts financial assets, was $1,605 billion.
Who holds Canada's debt?
Most Government of Canada securities are held in Canada. Non-resident investors held 35% in 2024–25, in line with the G7 average. Canada keeps a AAA credit rating from S&P, Moody's and Morningstar DBRS, and AA+ from Fitch.